Tag: Visual Tools
18 posts

Custom card deck
This demo has Moderate first enabled — answers won’t appear automatically. In your presentations, you can choose to review answers before showing them, or keep ...
Interactive wheel of life
Stakeholder mapping: identify and manage key project players A collaborative tool for building effective engagement strategies The success of any project depend...

Design Thinking Workshop
This demo has Moderate first enabled — answers won’t appear automatically. In your presentations, you can choose to review answers before showing them, or keep ...

Gratitude Circle
A roadmap for professional growth Professional growth doesn't happen by accident. You need a clear plan that connects where you are today with where you want to...

Collaborative learning experience
What is Collaborative Learning? Collaborative learning, a cornerstone of modern education, champions the synergy of teamwork and collective knowledge building. ...
Radar Chart Maker
Radar charts, also known as spider charts or radial graphs, are a dynamic tool in data visualization used to display multivariate data on a two-dimensional grap...

Bar Chart Generator
Bar charts are a staple in the world of data visualization, providing a clear and effective way to present categorical data. These charts use rectangular bars t...

Collaborative Moodboard Maker
What is a Moodboard? A moodboard, also known as a vision board, inspiration board or mood board, is a visual composition that conveys the emotional tone and aes...

Online Crazy 8's Brainstorm Sketching Tool
What is Crazy 8's? Crazy 8's is a dynamic sketching exercise derived from Google's Design Sprint methodology. This exercise serves as a fast-paced brainstorming...
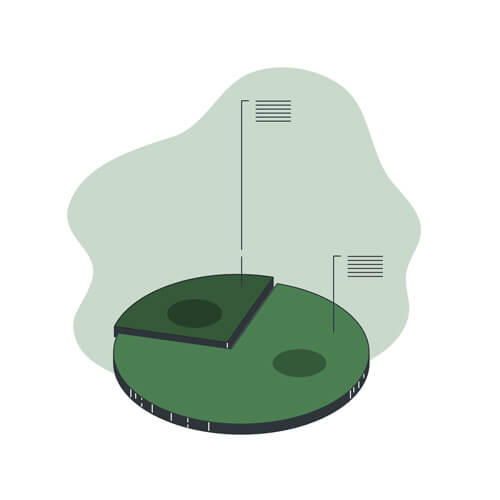
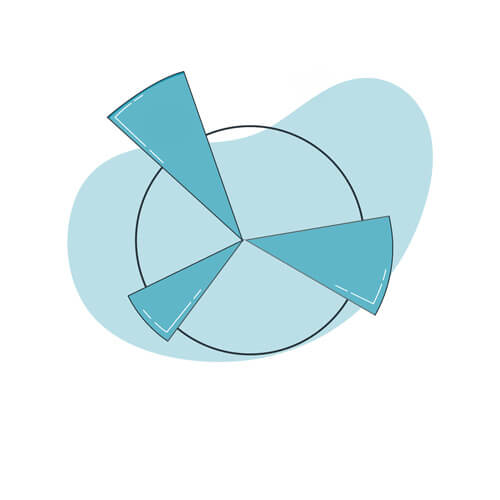
Pie chart maker with percentages
Pie charts are a fundamental tool in data visualization, effectively displaying the proportions of various categories relative to a whole. These charts split a ...
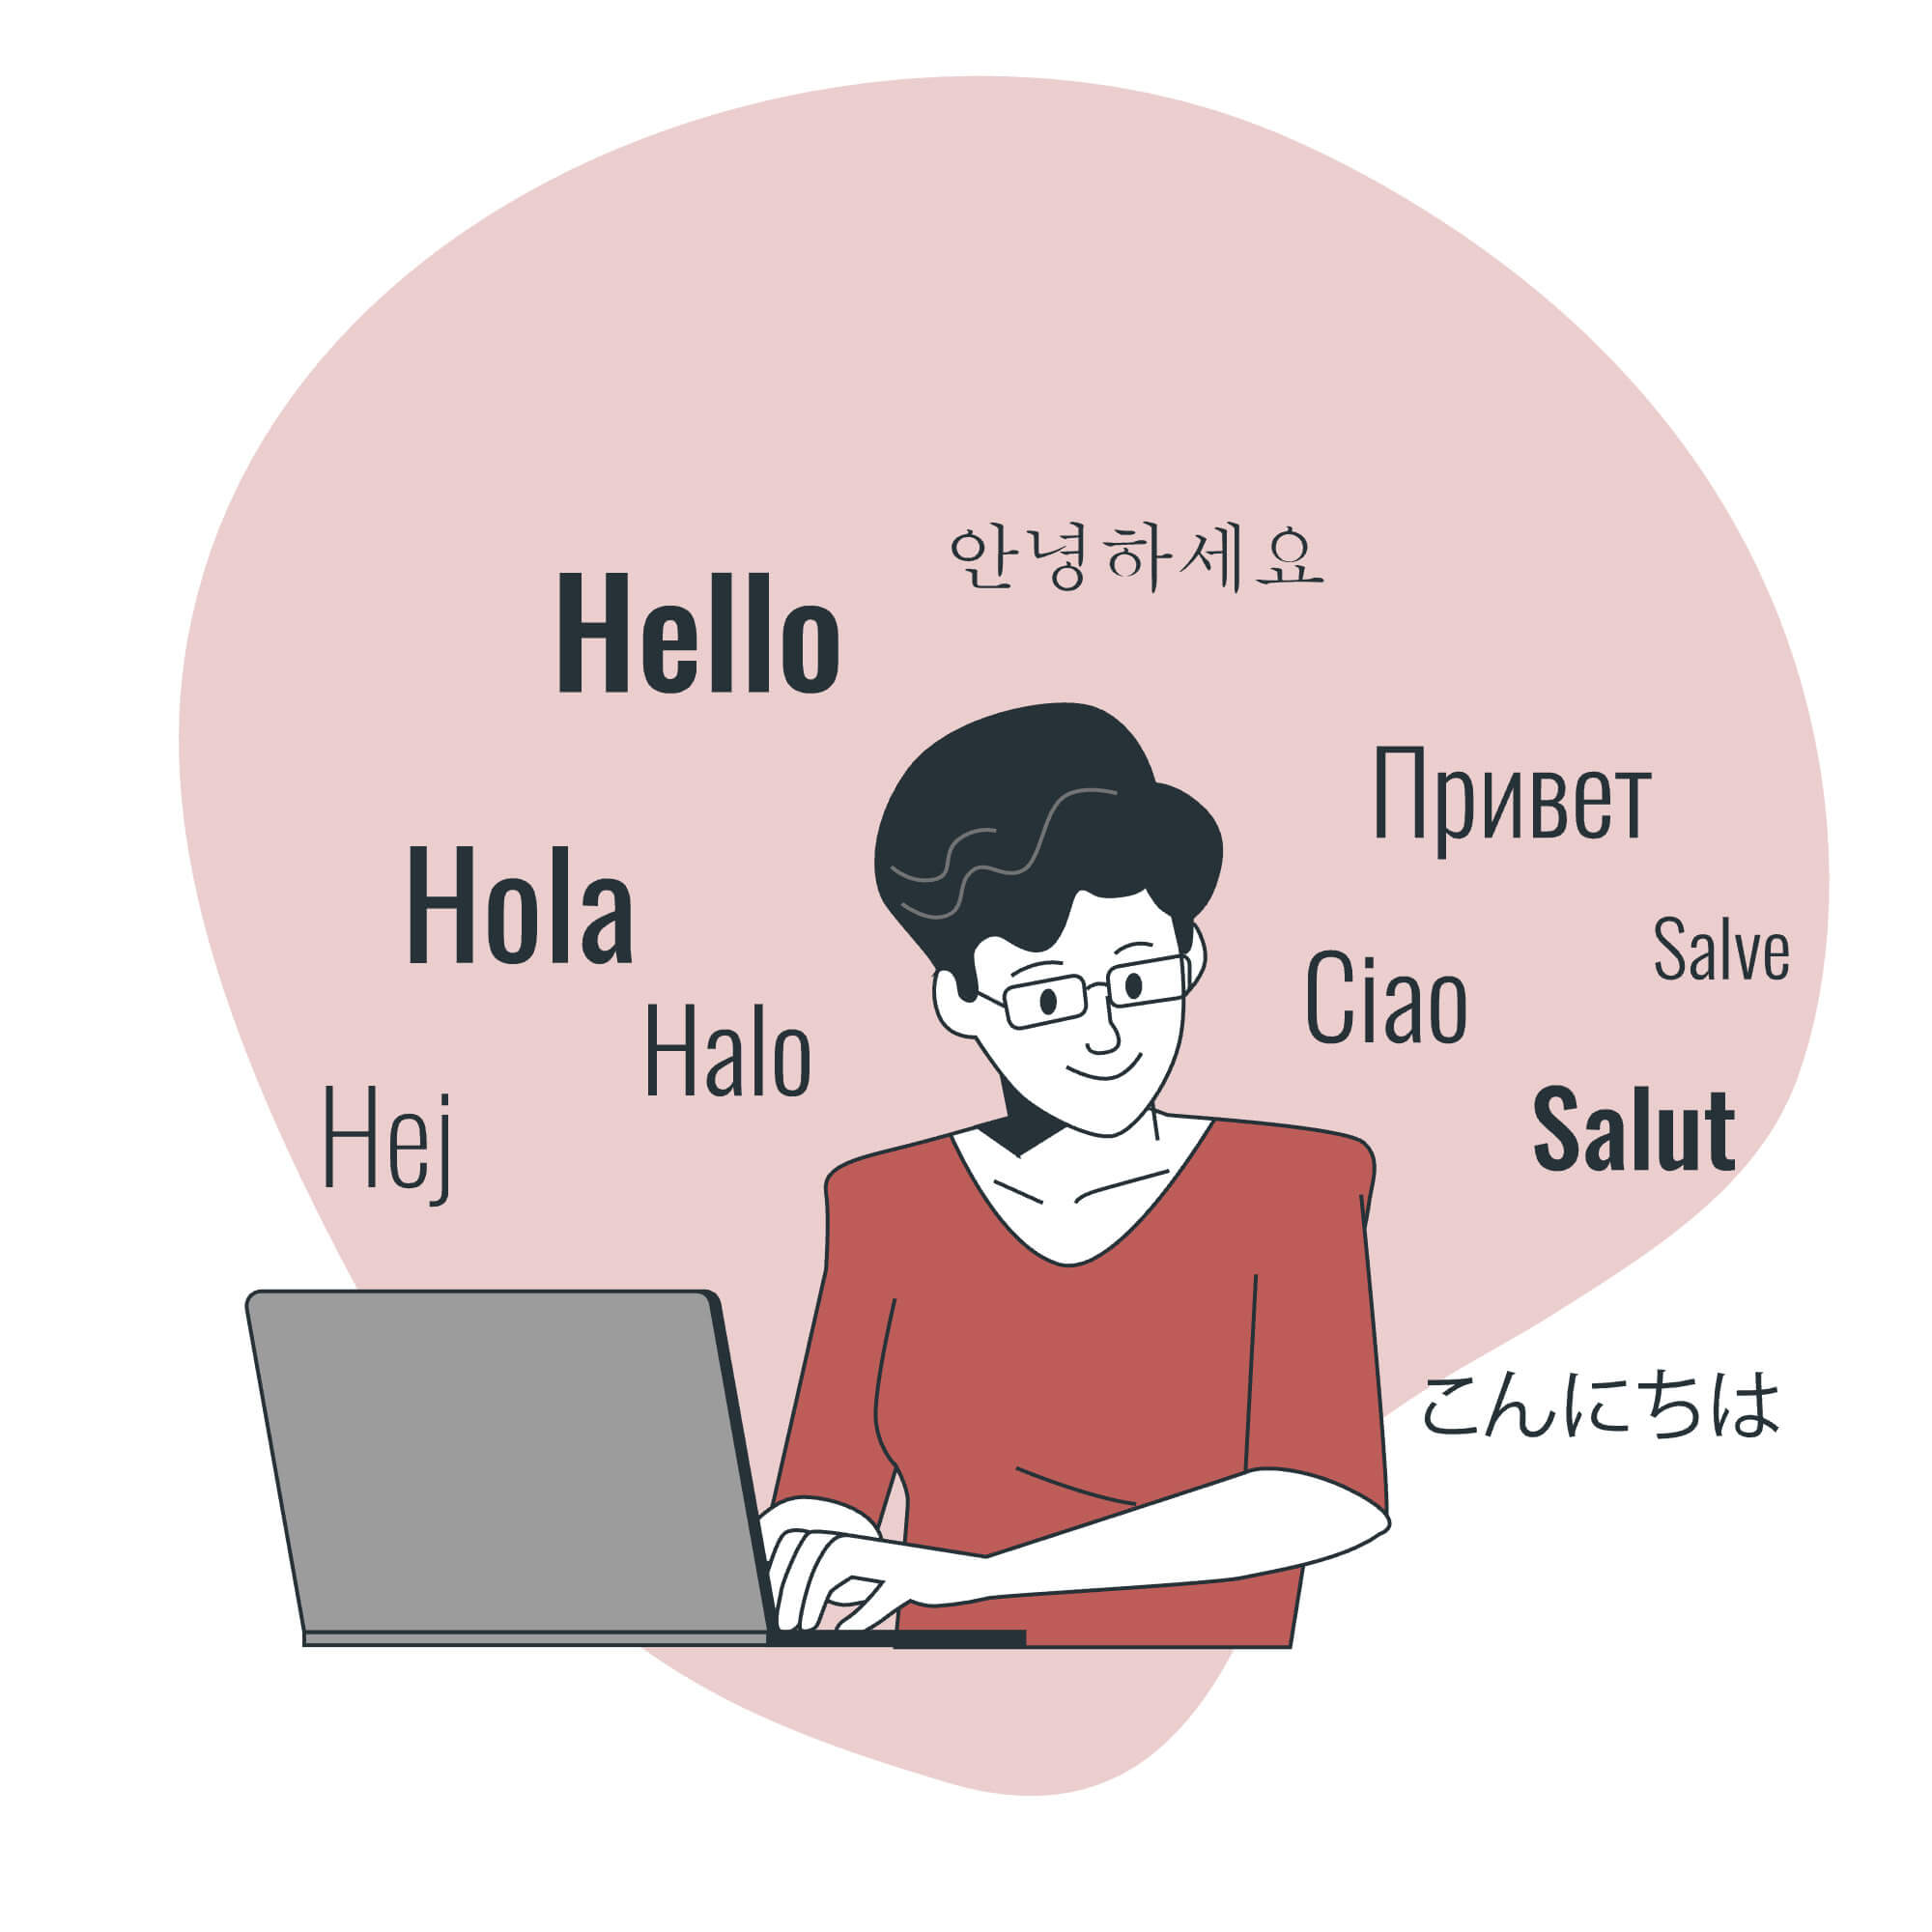
Collaborative Word Cloud
Word clouds, also known as tag clouds or word clusters, are visual representations of text data where the size of each word indicates its frequency or importanc...

Creative resume maker
In today's hyper-competitive job market, standing out with a unique CV is more than a necessity—it's your personal billboard. For creative professionals, showca...

Collaborative Pictogram Maker
Pictograms, the visual language of symbols, offer an intuitive way to communicate information quickly and effectively. With an interactive pictogram maker, you ...

Interactive presentation
What is an interactive presentation? An interactive presentation goes beyond the traditional slide-by-slide format, integrating interactive elements such as pol...

Emotional Intelligence Self-Assessment
Create your own Emotional Intelligence Self-Assessment Tool With Questiory creating an interactive, customized Emotional Intelligence Self-Assesssment Tool to y...

Social Comic Book Strip Creator
What is an interactive learning module? An interactive learning module is a self-contained educational experience that actively engages learners through hands-o...

Creative questionnaire
Creating a creative art workshop that engages through pattern exploration Hands-on activities that develop visual awareness and creative expression A well-desig...

Survey report example
Create a survey report instantly that updates in real-time as your audience complete a survey Survey reports play a crucial role in helping organizations collec...