Facilitation
Create your own interactive, collaborative radar chart in seconds
A radar chart that updates live while your group responds is a completely different experience from a static one. Here's how to set one up in Questiory in a few steps.
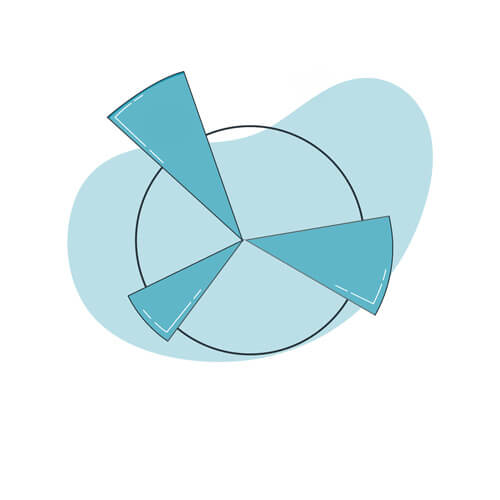
A radar chart, also known as a spider chart or polar diagram, displays multiple dimensions at once on a circular axis. Each spoke represents a variable, and the shape formed by connecting the points reveals the group’s profile at a glance.
What makes it useful in facilitation is that it lets you compare several dimensions simultaneously — something a bar chart or gauge can’t do. With Questiory, that chart builds live as participants respond, and the result is visible to the whole group in real time.
With a collaborative radar you can create very different experiences depending on the context: competency self-assessments, team diagnostics, values alignment, wheels of life, 360 feedback, culture checks, and much more. Any activity where you want the group to see its collective profile across multiple dimensions at once works well with this format.
Ways to capture data for your radar chart
Depending on how you want participants to contribute, you can pair the radar with different interaction types:
Step by step
1. Open a new presentation or use an existing one
Go to your Questiory dashboard and create a new presentation. You can start from scratch or duplicate an existing one to reuse a structure you already like.
2. Add a visualization slide
Inside the presentation editor, add a new slide and choose Visualization. This is the slide that will display results to the group in real time.
3. Select radar chart
From the visualization options, pick Radar. The radar chart plots multiple dimensions on a circular axis — each one becomes a spoke, and participant responses build the shape of the group’s collective view.
You define the dimensions: name each axis to match what you want to measure. These could be competencies, values, priorities, agreement levels — whatever makes sense for your context.
4. Choose how you want to capture data
This is where you decide what participants actually do. Depending on how you want to collect responses, you can pair the radar with different interaction types.
The most common pairing: Valuation. Each participant rates each dimension on a scale, and the radar builds from those averages. But you’re not limited to one format. A presentation can include any combination of interaction types — the radar will reflect whatever data you send it.
Share the link or QR code, and watch the radar build as responses come in.
What participants do
Click any card to learn more.
What the group sees
Examples of experiences that use collaborative radar charts
Interactive wheel of life
A coaching tool to visualize satisfaction levels across life areas, individually or as a group.
Radar chart
Build your own interactive radar chart generator to visualize multiple dimensions in real time.

360 emotional competencies radar
A feedback experience where people discover how they perceive themselves versus how their colleagues perceive them.
A radar chart is one of the formats that tends to make people pause and actually look. When the shape of the group’s collective thinking appears live on screen, it often opens conversations that wouldn’t have happened otherwise.
Worth trying in your next session.