Learn
How to create a collaborative pictogram
Build a collaborative pictogram in Questiory. The group contributes responses and the chart builds itself in real time using icons from a built-in library.
A collaborative pictogram in Questiory works differently from a regular infographic. Instead of you loading the data, the group contributes it, and the pictogram takes shape in real time as responses come in. It’s the kind of thing that tends to make people pay attention, because they see their input reflected immediately on screen.
This guide walks you through the steps.
Log in and create a new presentation
Go to author.questiory.com and log in to your account. From your dashboard, click New presentation and give it a name, something that helps you identify it later.
Add a pictogram visualization
Click New slide and add a visualization. Look for the Pictogram option in the visualizations list.
Once it’s on the canvas, you can configure the symbol, labels, and layout. Questiory will ask you to connect it to an interaction to pull data from — you’ll set that up in the next step.
Choose the interaction to capture data
The pictogram is compatible with two interaction types:

Multiple choice
Participants pick one or more options. Each option becomes a variable in the pictogram. Good for showing how the group distributes across categories.

Valuation
Participants rate statements on a numeric scale. Each statement becomes a variable. Good for showing levels or scores.
Click New slide and add the interaction type that fits your question. Set up your options or statements, then connect it to the pictogram visualization you created in the previous step.
Choose your pictogram
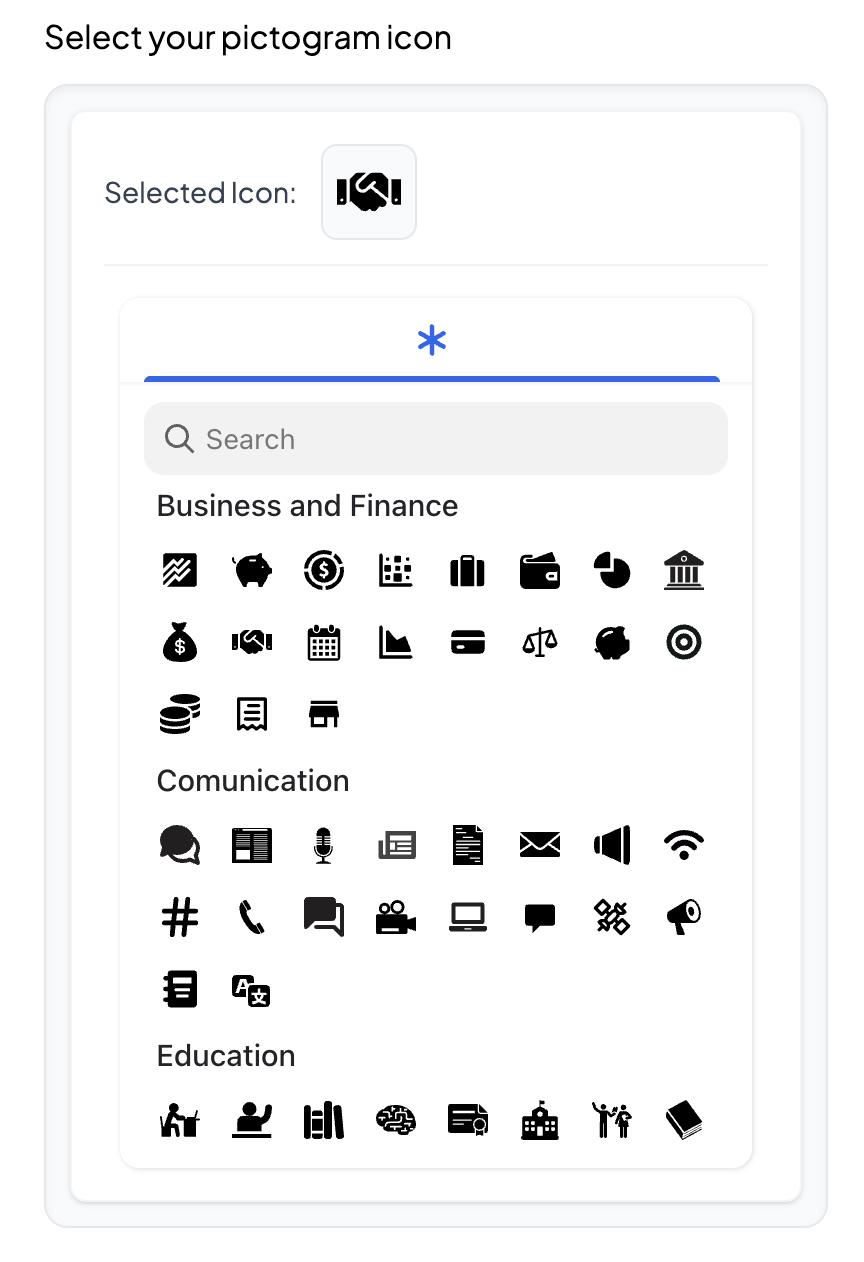
Once the pictogram visualization is on the canvas, you can choose the icon that represents each unit of data. Questiory has a library of symbols organized by category, with a search bar to find what you need quickly.
A few things that tend to work:
- Pick something that relates to your topic. People icons for headcount, books for learning, coins for budgets.
- Keep it simple. A clear, recognizable symbol reads faster at a glance than something decorative.
- You can use the same symbol throughout or assign different ones to each variable, depending on what you want to show.
Preview and share
Before sharing, click Open presentation to see what your participants will see. Submit a test response yourself to check that the pictogram updates correctly.
Once you’re satisfied, click Share to get the link, QR code, or embed code, and send it to your group when you’re ready.
The pictogram builds in real time as responses arrive. You can display it on a shared screen during a session, or let people check in asynchronously at their own pace.
Something worth noting: the pictogram stays live. You can keep it open across sessions, or close participations from the settings when you want to lock the results.
If you want to load the data yourself instead of collecting it from a group, that’s also possible. Enter the values directly into the interaction and enable Hide slide on that slide so only the pictogram visualization stays visible in the presentation.
You can also create a presentation with several pictogram slides, each showing a different variable or dataset. That gives you an interactive infographic where each slide is a live, data-driven chart built around a symbol.
Other guides that may be useful

Common questions about pictograms in Questiory
Which interaction type should I use for a pictogram?
Both Multiple Choice and Valuation work. Multiple Choice works well when you want to see how the group distributes across a set of categories. Valuation works better when you want to show scores or levels for specific statements. Choose based on the question you're trying to answer.
Can I use a pictogram from a previous session in a new presentation?
Yes. When adding a pictogram visualization, you can connect it to an interaction from any of your presentations, not just the current one. The visualization will display responses from that interaction regardless of where it lives.
Can I display the pictogram on a projector while participants respond on their phones?
Yes. Open the presentation on the device connected to your projector and navigate to the pictogram slide. As participants submit their responses, the pictogram updates on screen in real time.
Can I embed the pictogram on a website or course platform?
Yes. Use the embed option from the Share menu. You'll get an iframe snippet you can paste into any HTML-compatible page. The embedded version updates live, so visitors see the current state of the pictogram whenever they load the page.
Do responses accumulate over time or reset between sessions?
Responses accumulate by default. If you want a fresh start for a new session, you can clear the responses from the interaction settings before the session begins.
Can I use more than one symbol in the same pictogram?
It depends on the configuration. In some setups you can assign different symbols to different variables within the same pictogram. Check the visualization settings once the pictogram is on the canvas.